Australians pay more for education than the OECD average - but is it worth it?
Australians value education, so when looking at the OECD’s Education at a Glance 2017 report, it’s not surprising to see we spend more on education than average among comparable nations.
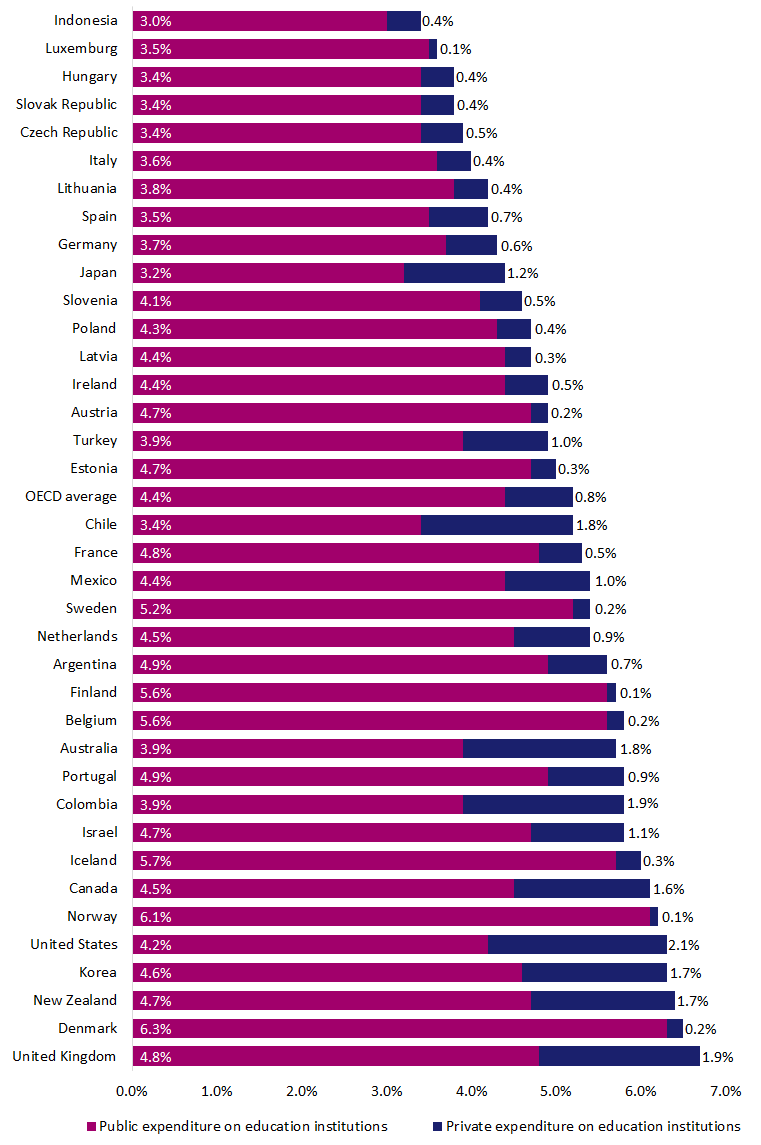
However, it’s worth noting where the money comes from. A closer look at the data shows public funding for education in Australia is much less than the OECD average, with private funders (including families and students) footing the rest of the bill. When combining both public and private funding sources, our overall spending on education is 5.8% of GDP from primary to tertiary levels. As our Federal Education Minister has been quick to note, this is more than the OECD average of 5.2%. However, when looking at public expenditure, Australia, at 3.9% of GDP, is well below most OECD countries.
Expenditure on educational institutions as a % of GDP
Including public subsidies to households attributable for educational institutions, and direct expenditure on educational institutions from international sources.
Infographic text alternative:
Figure showing the following different countries' public and private expenditure on educational institutions as a percentage of GDP (percentages include public subsidies to households attributable for educational institutions, and direct expenditure on educational institutions from international sources): Indonesia - 3.0% public, 0.4% private; Luxembourg - 3.5% public, 0.1% private; Hungary - 3.4% public, 0.4% private; Slovak Republic - 3.4% public, 0.4% private; Czech Republic - 3.4% public, 0.5% private; Italy - 3.6% public, 0.4% private; Lithuania - 3.8% public, 0.4% private; Spain - 3.5% public, 0.7% private; Germany - 3.7% public, 0.6% private; Japan - 3.2% public, 1.2% private; Slovenia - 4.1% public, 0.5% private; Poland - 4.3% public, 0.4% private; Latvia - 4.4% public, 0.3% private; Ireland - 4.4% public, 0.5% private; Austria - 4.7% public, 0.2% private; Turkey - 3.9% public, 1.0% private; Estonia - 4.7% public, 0.3% private; OECD average - 4.4% public, 0.8% private; Chile - 3.4% public, 1.8% private; France - 4.8% public, 0.5% private; Mexico - 4.4% public, 1.0% private; Sweden - 5.2% public, 0.2% private; Netherlands - 4.5% public, 0.9% private; Argentina - 4.9% public, 0.7% private; Finland - 5.6% public, 0.1% private; Belgium - 5.6% public, 0.2% private; Australia - 3.9% public, 1.8% private; Portugal - 4.9% public, 0.9% private; Colombia - 3.9% public, 1.9% private; Israel - 4.7% public, 1.1% private; Iceland - 5.7% public, 0.3% private; Canada - 4.5% public, 1.6% private; Norway - 6.1% public, 0.1% private; United States - 4.2% public, 2.1% private; Korea - 4.6% public, 1.7% private; New Zealand - 4.7% public, 1.7% private; Denmark - 6.3% public, 0.2% private; United Kingdom - 4.8% public, 1.9% private.
Source: OECD
Government spending on education increased by 6% from 2010 to 2014, but total government expenditure for all services increased by 18% over this time. So, in relative terms, expenditure on education as a proportion of all government expenditure has decreased.
Why does Australia rely so much on private sources to fund education, and are we getting enough for what we pay?
Early childhood education and care
Early childhood education and care (ECEC) in Australia is disproportionately funded by private sources compared to most OECD countries. One third of all expenditure on early childhood institutions, on average, comes from private sources. This is most often parents and families.
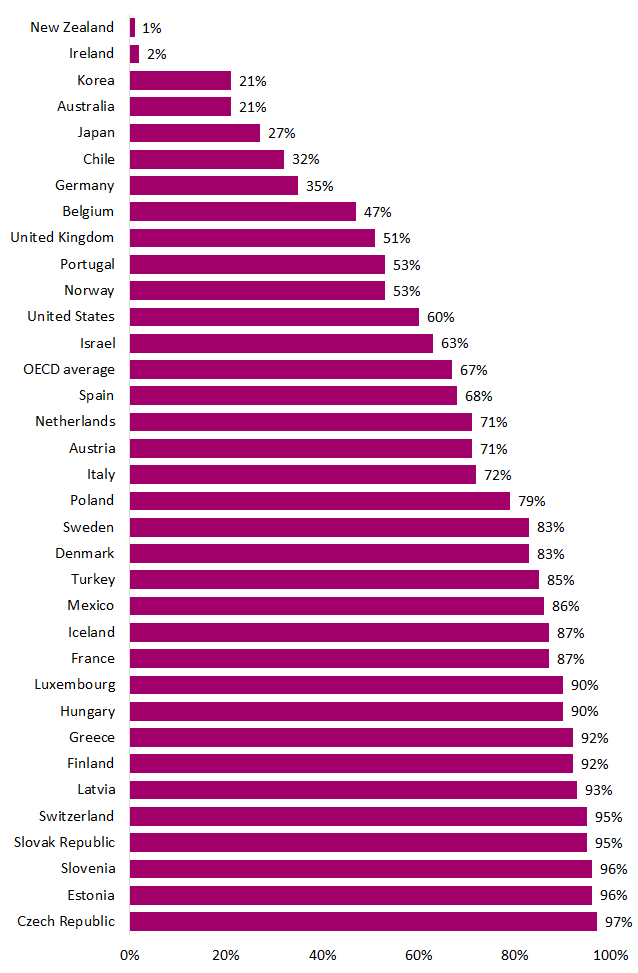
Only Japan, Portugal and the United Kingdom have higher shares of private expenditure on pre-primary education. Australia has a unique model, with only one in five children that attend ECEC enrolled in a public institution, compared to nearly 70% average across the OECD.
Percentage of children attending a public institution for early childhood education and care (ECEC)
OECD countries, 2015
Infographic text alternative:
Figure showing the percentages of children attending a public institution for early childhood education and care in OECD countries in 2015: New Zealand - 1%; Ireland - 2%; Korea - 21%; Australia - 21%; Japan - 27%; Chile - 32%; Germany - 35%; Belgium - 47%; United Kingdom - 51%; Portugal - 53%; Norway - 53%; United States - 60%; Israel - 63%; OECD average - 67%; Spain - 68%; Netherlands - 71%; Austria - 71%; Italy - 72%; Poland - 79%; Sweden - 83%; Denmark - 83%; Turkey - 85%; Mexico - 86%; Iceland - 87%; France - 87%; Luxembourg - 90%; Hungary - 90%; Greece - 92%; Finland - 92%; Latvia - 93%; Switzerland - 95%; Slovak Republic - 95%; Slovenia - 96%; Estonia - 96%; Czech Republic - 97%.
Source: OECD
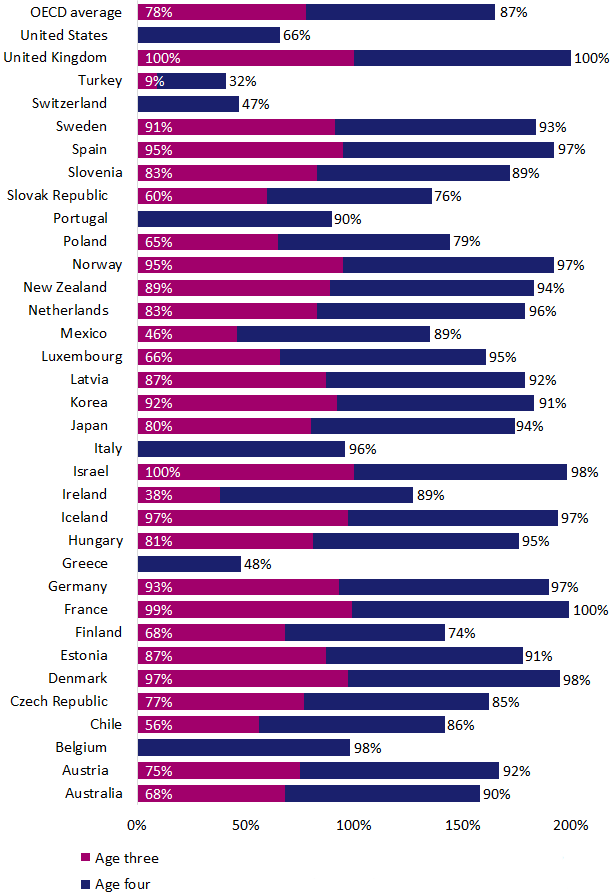
We have achieved huge growth in enrolment rates for four-year-olds in pre-primary and primary education, with 90% enrolled in 2015 compared to 53% in 2005. This was largely driven by the 2008 National Partnership Agreement on Universal Access to Early Childhood Education. However, the OECD average also jumped significantly over those ten years, so Australia is now performing just above the OECD average of 87%.
This achievement is overshadowed by our poor performance in lifting three-year-old participation. Australia has 68% of three-year-old children enrolled in a form of ECEC, below the OECD average of 78%. Only about one in five three-year-olds attend preschool. This is well below the OECD average of 73 per cent.
Enrolment rates in pre-primary education
By age, OECD countries, 2015
Infographic text alternative:
Figure showing the percentages of children enrolled in pre-primary education at age three and age four in OECD countries in 2015: OECD average - 78% at age three, 87% at age four; United States - 66% at age four; United Kingdom - 100% at age three, 100% at age four; Turkey - 9% at age three, 32% at age four; Switzerland - 47% at age four; Sweden - 91% at age three, 93% at age four; Spain - 95% at age three, 97% at age four; Slovenia - 83% at age three, 89% at age four; Slovak Republic - 60% at age three, 76% at age four; Portugal - 90% at age four; Poland - 65% at age three, 79% at age four; Norway - 95% at age three, 97% at age four; New Zealand - 89% at age three, 94% at age four; Netherlands - 83% at age three, 96% at age four; Mexico - 46% at age three, 89% at age four; Luxembourg - 66% at age three, 95% at age four; Latvia - 87% at age three, 92% at age four; Korea - 92% at age three, 91% at age four; Japan - 80% at age three, 94% at age four; Italy - 96% at age four; Israel - 100% at age three, 98% at age four; Ireland - 38% at age three, 89% at age four; Iceland - 97% at age three, 97% at age four; Hungary - 81% at age three, 95% at age four; Greece - 48% at age four; Germany - 93% at age three, 97% at age four; France - 99% at age three, 100% at age four; Finland - 68% at age three, 74% at age four; Estonia - 87% at age three, 91% at age four; Denmark - 97% at age three, 98% at age four; Czech Republic - 77% at age three, 85% at age four; Chile - 56% at age three, 86% at age four; Belgium - 98% at age four; Austria - 75% at age three, 92% at age four; Australia - 68% at age three, 90% at age four.
Source: OECD
The OECD notes that two years of ECEC appears to boost PISA results and have a positive impact of life outcomes, so it is well worth lifting investment to increase the number of three-year-olds entering pre-primary education. Australia has significant work to do to achieve the OECD average. Experiences with four-year-old preschool show it can be done.
Schooling
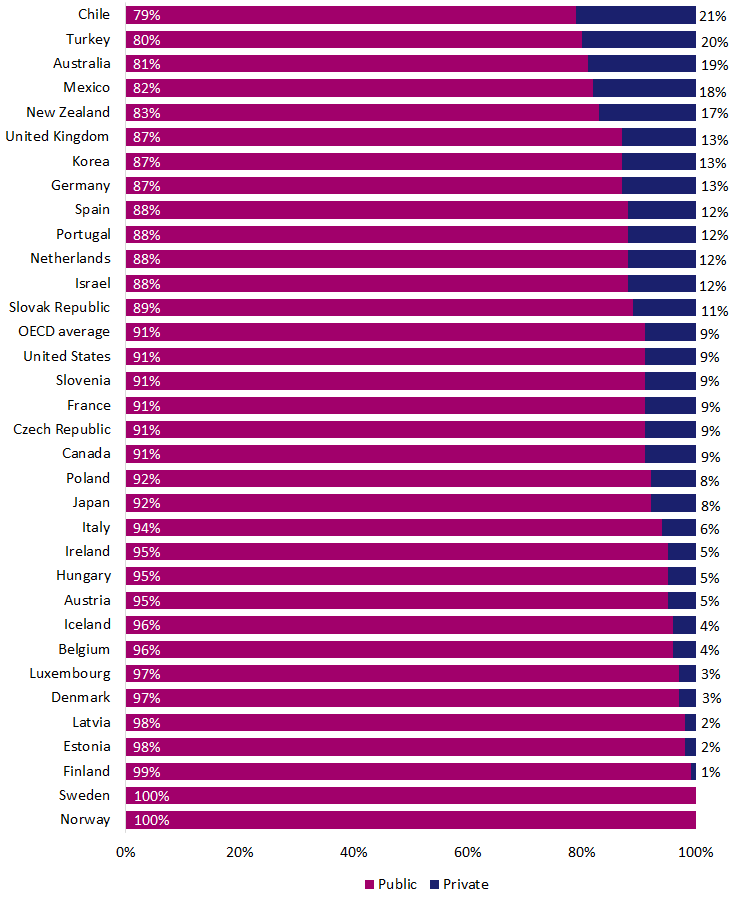
On average across the OECD, 91 per cent of expenditure on school-age education comes from public sources, but Australia’s public contribution is only 81% of total expenditure. Households account for 16%. Levels of expenditure from private sources increase from 12% in primary to 24% in lower secondary – the highest in the OECD. A similar level of private investment is in upper secondary education.
Share of expenditure on primary, secondary and non-tertiary post secondary education
OECD countries, 2014
Infographic text alternative:
Figure showing the share of public and private expenditure on primary, secondary and non-tertiary post-secondary education in OECD countries in 2014: Chile - 79% public, 21% private; Turkey - 80% public, 20% private; Australia - 81% public, 19% private; Mexico - 82% public, 18% private; New Zealand - 83% public, 17% private; United Kingdom - 87% public, 13% private; Korea - 87% public, 13% private; Germany - 87% public, 13% private; Spain - 88% public, 12% private; Portugal - 88% public, 12% private; Netherlands - 88% public, 12% private; Israel - 88% public, 12% private; Slovak Republic - 89% public, 11% private; OECD average - 91% public, 9% private; United States - 91% public, 9% private; Slovenia - 91% public, 9% private; France - 91% public, 9% private; Czech Republic - 91% public, 9% private; Canada - 91% public, 9% private; Poland - 92% public, 8% private; Japan - 92% public, 8% private; Italy - 94% public, 6% private; Ireland - 95% public, 5% private; Hungary - 95% public, 5% private; Austria - 95% public, 5% private; Iceland - 96% public, 4% private; Belgium - 96% public, 4% private; Luxembourg - 97% public, 3% private; Denmark - 97% public, 3% private; Latvia - 98% public, 2% private; Estonia - 98% public, 2% private; Finland - 99% public, 1% private; Sweden - 100% public; Norway - 100% public.
Source: OECD
The data are clear on the need for more young people to achieve Year 12. Unemployment rates correlate closely with qualifications, from 12% for non-Year 12 completers, to 6.1% for Year 12 completers and 3.4% for tertiary graduates.
One in eight young people are not in employment, education and training. This number has not changed over the last six years. We need to refocus our education system to provide young people with the education, capability and pathways support they need to successfully transition to further education and employment.
Tertiary
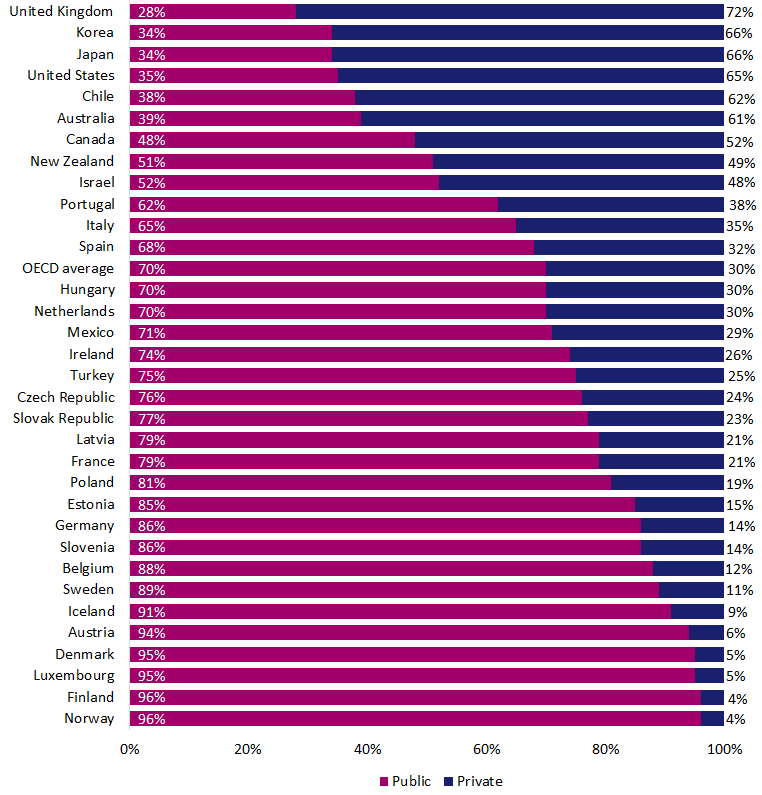
At the tertiary level, Australian households and international students contribute more than double the OECD average expenditure. Private sources amount to 61% of expenditure, compared to an OECD average of 30%. Chile and Japan are the only countries where households account for a greater share of expenditure on tertiary education institutions, at 55% and 51% respectively.
Share of expenditure on tertiary education
OECD countries, 2014
Infographic text alternative:
Figure showing the share of public and private expenditure on tertiary education in OECD countries in 2014: United Kingdom: 28% public, 72% private; Korea - 34% public, 66% private; Japan - 34% public, 66% private; United States - 35% public, 65% private; Chile - 38% public, 62% private; Australia - 39% public, 61% private; Canada - 48% public, 52% private; New Zealand - 51% public, 49% private; Israel - 52% public, 48% private; Portugal - 62% public, 38% private; Italy - 65% public, 35% private; Spain - 68% public, 32% private; OECD average - 70% public, 30% private; Hungary - 70% public, 30% private; Netherlands - 70% public, 30% private; Mexico - 71% public, 29% private; Ireland - 74% public, 26% private; Turkey - 75% public, 25% private; Czech Republic - 76% public, 24% private; Slovak Republic - 77% public, 23% private; Latvia - 79% public, 21% private; France - 79% public, 21% private; Poland - 81% public, 19% private; Estonia - 85% public, 15% private; Germany - 86% public, 14% private; Slovenia - 86% public, 14% private; Belgium - 88% public, 12% private; Sweden - 89% public, 11% private; Iceland - 91% public, 9% private; Austria - 94% public, 6% private; Denmark - 95% public, 5% private; Luxembourg - 95% public, 5% private; Finland - 96% public, 4% private; Norway - 96% public, 4% private.
Source: OECD
Tertiary education provides a strong public (around $150,000 per male graduate) and private benefit (around $233,000 per male graduate). This is more than a 9% return on both public and private investment.
A strong tertiary system is vital for Australia’s future, with a need to ensure strong pathways across university and vocational education and training.
Are we getting enough for what we pay?
Australia is unique in having significant levels of private funding, and delivery by private institutions, from early childhood through to tertiary. The returns from education are strong for those who complete. However, despite the significant spend, the education system is not maximising the talents of all children and young people.
Our results in international tests like PISA are declining and many children are missing out at important education milestones before, during and after school.
It is clear that spending more money on education doesn’t necessarily buy better results. We need to focus not just on how much we spend, but on who and for what outcome.
This article was originally published on The Conversation. Read the original article.