Socio-economic disadvantage & educational opportunity persistently linked

Despite Australia’s commitment to equity and opportunity for all, a student’s family background still plays an unacceptably large role in determining his or her educational pathway.
At all stages of learning and development, there remains a strong and persistent link between a young person’s socio-economic status and educational outcomes.
The evidence shows that Australia’s education system is not doing enough to address inequality between the most and least advantaged young people, and some features of the system may actually be widening the gap.
Educational opportunity in Australia 2015 is one of the most comprehensive data studies of Australia’s education system. It examines young people’s progress on four key educational milestones, from the early years right through to young adulthood.
Key findings
- Socio-economic disadvantage has a greater impact on educational opportunity than any other factor considered in the study. Australia’s education system is not working well for the most disadvantaged young people.
- For each milestone, the proportion of the most disadvantaged students who meet the milestone is between 10 and 20 percentage points lower than for the Australian population as a whole.
- Students from the most disadvantaged groups who are off track at one milestone are less likely to catch up again at another milestone.
- Differences in outcomes are compounded by differences in access to educational services. Socio-economically disadvantaged students attend fewer hours of early childhood education, have lower attendance at school, are more likely to leave school early, and are less likely to go to university.
- The effects of socio-economic disadvantage persist well beyond school, reflected in higher chances of not finding full-time work and not being in education and training.
- In part, because Indigenous young people are over-represented in the most socio-economically disadvantaged group, Indigenous students are significantly less likely to benefit from the opportunities that the Australian education system has to offer.
Proportion of students meeting educational milestones by socio-economic category
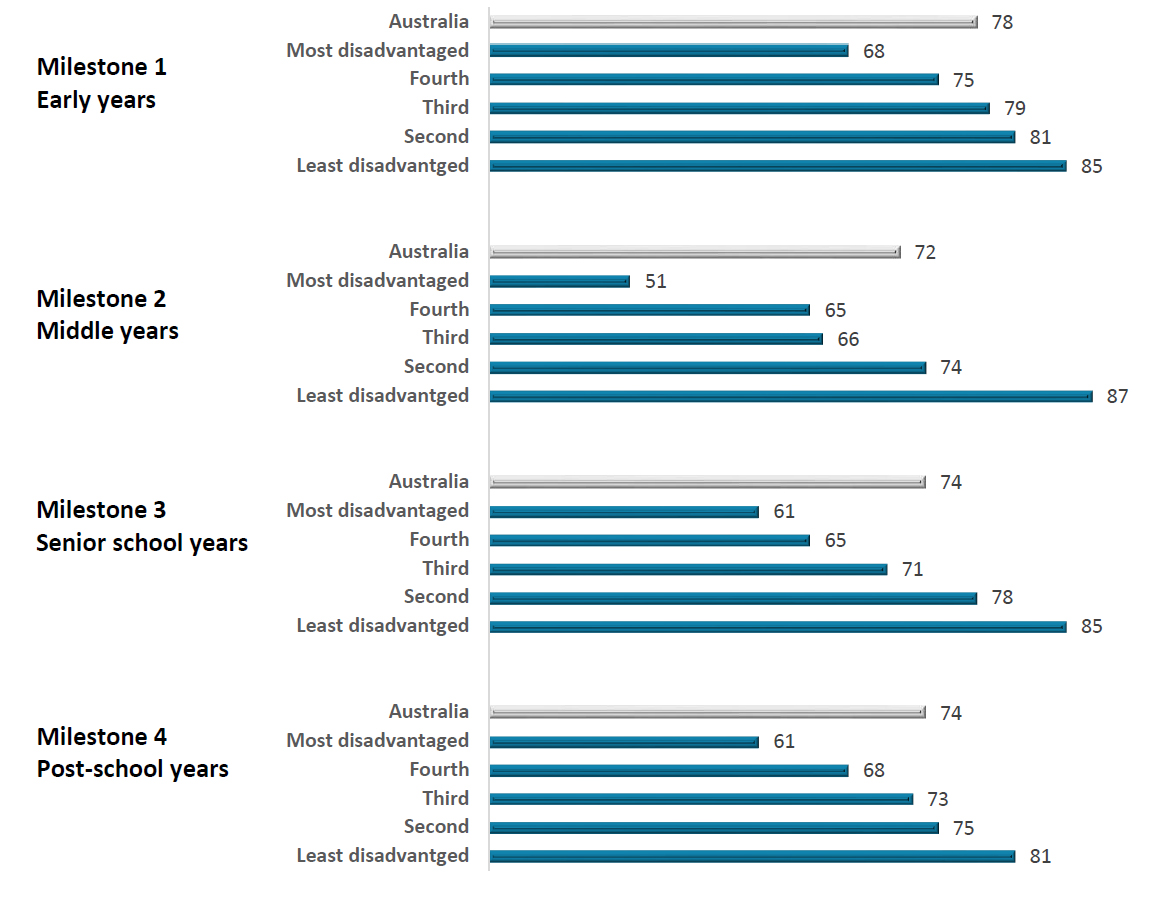
Graph text alternative
Graph showing the percentage of students in Australia meeting educational milestones by socio-economic category. For all milestones, the percentages of students meeting them increases by socio-economic category. For Milestone 1 early years, the overall percentage for Australia is 78% and the category precentages range from 68% for most disadvantaged to 85% for least disadvantaged. For Milestone 2 middle years, the overall percentage for Australia is 72% and the category precentages range from 51% for most disadvantaged to 87% to least disadvantaged. For Milestone 3 senior school years, the overall percentage for Australia is 74% and the category percentages range from 61% for most disadvantaged to 85% to least disadvantaged. For Milestone 4 post-school years, the overall percentage for Australia is 74% and the category precentages range from 61% for most disadvantaged to 81% to least disadvantaged.
Source: Educational opportunity in Australia 2015, Mitchell Institute
What does this tell us?
The research shows a clear and persistent relationship between socio-economic status and educational outcomes in Australia across all the milestones. While Australia’s highest-achieving students are among the best in the world, the vast differences in educational opportunity across socio-economic groups challenge Australia’s claims of an education system that is fair and competitive by international standards.
The size and persistence of this relationship throws up clear challenges for educational policy-makers and service providers, to strengthen the ability of the education system to meet the needs of the most disadvantaged groups.
Socio-economic disadvantage remains a key influence on educational opportunity at every stage of learning and development in Australia.
Funding is part of this response. Recent developments in school funding, including those advocated by the (Gonski) Review of Funding in Schooling, seek to address inequality by directing resources to the areas of greatest need. But there remains variability in how well funding structures mitigate the effects of socio-economic disadvantage on educational opportunity, including in the early childhood and post-school years.
Inequality cannot be addressed by funding alone. Educational opportunity in Australia 2015 shows that the nature of educational inequality is complex, and differences in academic outcomes are linked to differences in participation and engagement at all levels of the education system. Systems across Australia must identify ways to connect those young people most in need with the education providers who are best able to support them. This involves tackling difficult questions about how the system currently works to marginalise young people at every stage.
While those missing out must be a priority, Educational opportunity in Australia 2015 also shows the achievements of systems, education providers and young people themselves, in creating an education system in which a majority of students are on track at every milestone. The report aims to inform efforts to build on these successes, and identify areas where Australia’s education system can better provide opportunity to all.
What was measured?
Milestone 1 – Early years looked at which children were developmentally ready at the point of entry to school, across all five domains of the Australian Early Development Census: physical health and wellbeing, social competence, emotional maturity, language and cognitive skills and communication and general knowledge.
Milestone 2 – Middle years looked at the academic outcomes of Australian students at Year 7 – examining which students were at the mid-point of the third achievement band in reading for the National Assessment Program Literary and Numeracy (NAPLAN).
Milestone 3 – Senior school years examined how many young people had attained Year 12 or an equivalent qualification (at the level of Certificate III or higher) by the age of 19, using ABS Census data.
Milestone 4 – Post-school years used ABS Labour Force data to determine how many young people were engaged in full time work, training or study at age 24.
Factsheets in this series
- Fact sheet 1 – Socio-economic disadvantage and educational opportunity persistently linked
- Fact sheet 2 – Early years: Gaps in educational opportunity evident at entry to school
- Fact sheet 3 – Middle years: Achievement gaps widen at Year 7
- Fact sheet 4 – Senior school years: School completion uneven across Australia
- Fact sheet 5 – Post-school years: Many 24 year olds marginalised, but second chances help
- Fact sheet 6 – Young people in rural and remote communities frequently missing out
More information
Educational opportunities in Australia 2015 was prepared by the Centre for International Research on Education Systems at Victoria University for the Mitchell Institute.