Early learning report card: Australia is improving rapidly, but there’s more work to do

Quality early education can set a child up for life, allowing them to develop to their full potential. High quality and affordable early learning opportunities need to be a reality in Australia.
Monday 11 September 2017
Quality early education can set a child up for life, allowing them to develop to their full potential. High quality and affordable early learning opportunities need to be a reality for all children in Australia.
A new report from the Early Learning Everyone Benefits campaign (ELEB) tracks progress across a range of different early childhood education and care (ECEC) measures.
It shows that while the National Partnership on Universal Access to Early Education has driven significant rises in preschool participation in the year before full time school, Australia still lags behind comparable OECD countries in the participation of younger children – particularly three year olds.
It also highlights the persistent correlation between socioeconomic status and early childhood outcomes in Australia, as well as the diversity and fragmented nature of our early childhood sector.
Child development
Research shows a strong correlation between socioeconomic status and developmental vulnerability at the start of school.
In 2015, one in five children started school developmentally vulnerable. Children from disadvantaged backgrounds are more than twice as likely to be developmentally vulnerable at the start of school, and this number increases to two in five for Aboriginal and Torres Strait Islander children. The effect of disadvantage is evident across all areas of development, and is not changing over time.
This gap between the most advantaged and least advantaged children, in both learning and well-being, creates significant challenges for an education system already struggling to reduce the gap in achievement.
Participation
The ELEB report shows the National Partnership on Universal Access to Early Education has driven significant rises in preschool participation in the year before full-time school. In 2015, 91% of children participated in 15 hours per week, which is within reach of the 95% target. All states and territories, except New South Wales, met the target in 2015.
Proportion of children enrolled in preschool in year-before full-time schooling for 600 hours or more
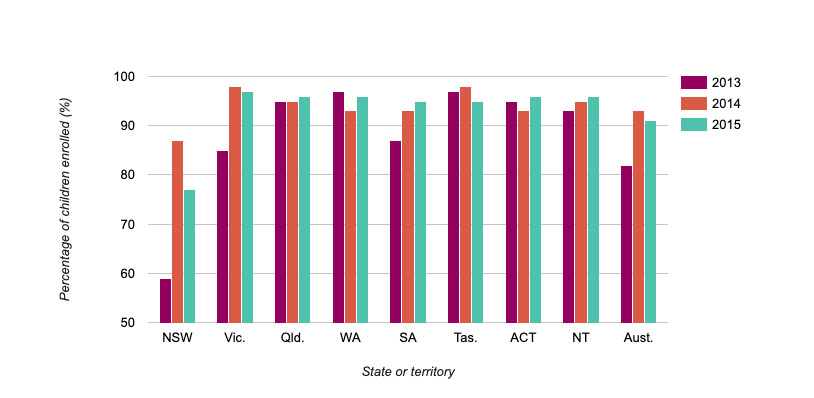
Source: National Report on National Partnership Agreement on Universal Access to ECE (2013-14) and (2014-15)
Graph text alternative
This graph shows the percentage of children enrolled in preschool in year-before full-time schooling for 600 hours or more, in each state or territory and Australia overall, in 2013, 2014 and 2015 respectively.
The graph shows that in the majority of states and territories, the percentage enrolled was lowest in 2013, increased in 2014 and decreased slightly in 2015. However, in QLD the percentage stayed the same in 2013 and 2014, and increased in 2015. In WA the percentage started high (in 2013), decreased in 2014 and increased in 2015 (but not to as high as in 2013). In ACT the percentage decreased in 2014 and then increased again in 2015. In NT there was a steady increase from 2013 to 2014 to 2015.
In Australia overall, the percentage enrolled was just above 80% in 2013, around 94% in 2014 and then around 91% in 2015.
However, it shows Australia still lags behind comparable OECD countries in the participation of younger children – particularly three-year-olds. Only 89% of four- year-olds, 62% of three-year-olds and 35% of Australian children aged birth to two participated in early childhood education and care in 2015.
We continue to rank below the OECD average for the participation of three-year-olds and four-year-olds, although we have had the fastest growth of any OECD country over the past decade.
Enrolment rates at age three in early childhood education & care in OECD countries, 2014
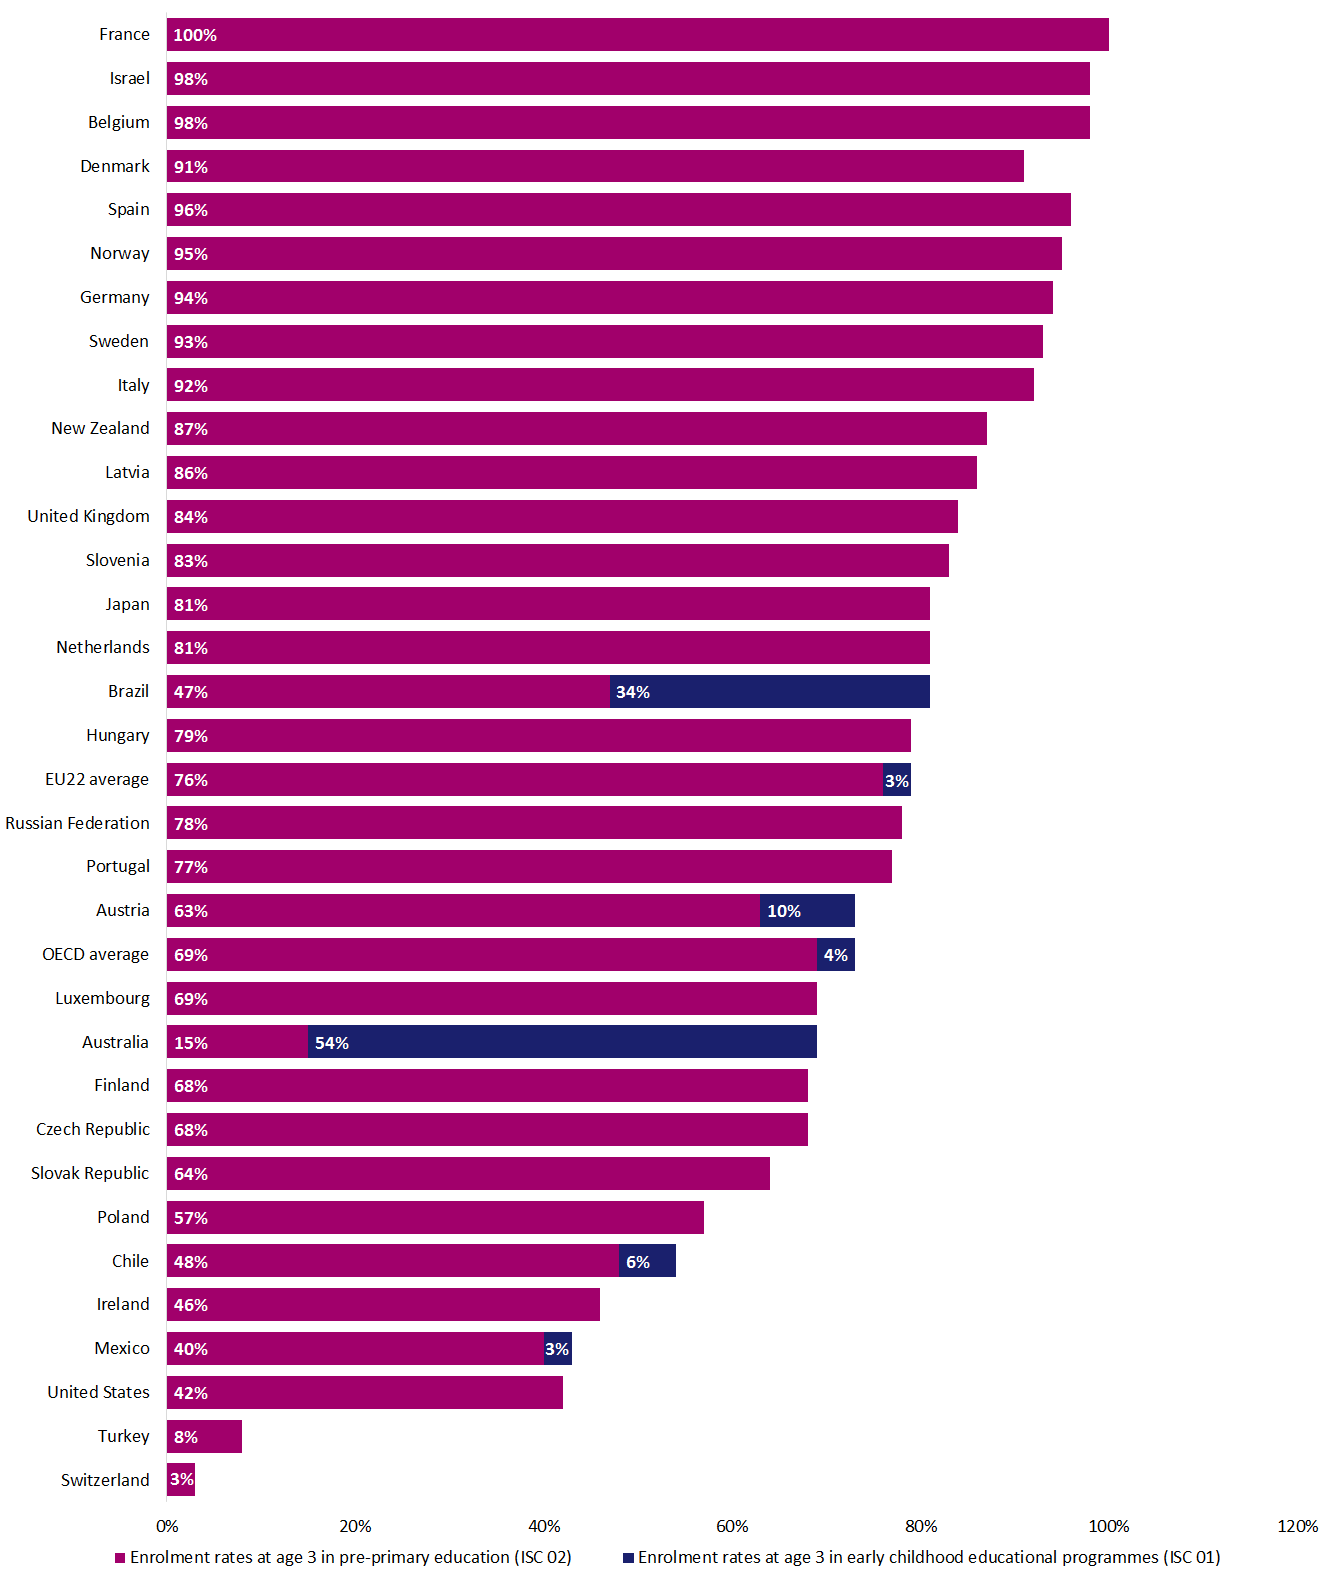
Source: OECD Education at a Glance, 2016
Graph text alternative
This graph shows enrolment rates at age three in early childhood education & care in OECD countries, from 2014. All percentages refer to enrolment rates at age 3 in early childhood educational programs (ISC 01), unless otherwise specified (enrolment rates at age 3 in pre-primary education (ISC 02)).
The following countries and percentages are listed: France (100%), Israel (98%), Belgium (98%), Denmark (91%), Spain (96%), Norway (95%), Germany (94%), Sweden (93%), Italy (92%), New Zealand (87%), Latvia (86%), United Kingdom (84%), Slovenia (83%), Japan (81%), Netherlands (81%), Brazil (47% in pre-primary education (ISC 02), 34% in early childhood educational programs (ISC 01)), Hungary (79%), EU22 average (76% in ISC 02, 3% in ISC 01), Russian Federation (78%), Portugal (77%), Austria (63% ISC 02, 10% ISC 01), OECD average (69% ISC 02, 4% ISC 01), Luxembourg (69%), Australia (15% ISC 02, 54% ISC 01), Finland (68%), Czech Republic (68%), Slovak Republic (64%), Poland (57%), Chile (48% ISC 02, 6% ISC 01), Ireland (46%), Mexico (40% ISC 02, 3% ISC 01), United States (42%), Turkey (8%), Switzerland (3%).
The low rate of participation among three year olds in Australia is of particular concern. Research indicates that two years of a high-quality preschool program delivers better outcomes than one year, especially for children who are developmentally vulnerable.
Diversity, complexity & quality improvement
The Australian ECEC sector is complex, with a diverse mix of funding streams (all levels of government and families contribute), provider types (for profit, not-for-profit, government, community managed and private) and delivery settings (long day care, family day care, sessional preschool and school-based).
There are strengths to this diversity, but it can create challenges for coherent policy. State and territory governments share responsibility for early childhood education with the federal government. Early education systems across each state and territory are varied and have differing proportions of community, private and state education department providers.
Although the National Quality Framework (NQF) has laid a solid foundation on which to build quality in the sector, the process of assessing all early learning and care providers has taken time. At the end of March 2017, 88% of services had been assessed, with 73% “meeting” or “above” the National Quality Standard.
In addition, competing policy objectives continue to create complexity for policy implementation. For example, the federal government’s new Jobs for Families Child Care Package, centred on reform of the childcare subsidy scheme, has a focus on parents’ workforce participation. But the NQF focuses on improving learning outcomes, and the National Partnership Agreement focuses on building participation.
Unaligned policy objectives can result in tensions, such as between raising standards of care and ensuring childcare is affordable. They can also deliver adverse policy outcomes: for example, when eligibility requirements for funding reduce access to early learning.
Investment
Australian governments are recognising the benefits of early childhood education, which is reflected in their investment.
Total Commonwealth, state and territory government expenditure on ECEC services was $9.1 billion in 2015–16, compared with $8.8 billion in 2014–15. Federal Government spending on early childhood services has grown rapidly over the past decade, from $2.9 billion in 2006–07 to $7.4 billion in 2015–16.
State & territory government real expenditure on all early childhood & care services in 2015-16 dollars, $000
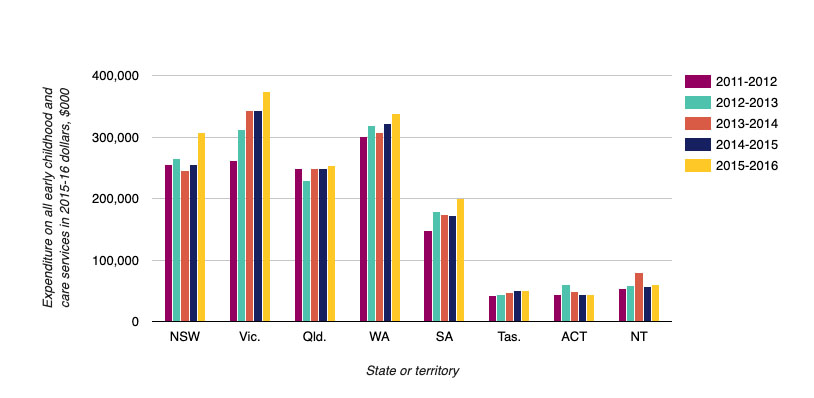
State and territory figures include all expenditure on early childhood and care from birth to 12 years (which includes outside school hours care). Source: SCRGSP, 2017
Graph text alternative
This graph shows State & territory government real expenditure on all early childhood & care services in 2015-16, compared with previous years (2011-12, 2012-13, 2013-14, 2014-15) in dollars. Please note the figures below are an estimate based on what's visible in the graph.
- In NSW expenditure was around: $250,000 in 2011-12, $260,000 in 2012-13, $240,000 in 2013-14, $250,000 in 2014-2015, $305,000 in 2015-16.
- In Vic expenditure was around: $260,000 in 2011-12, $305,000 in 2012-13, $340,000 in 2013-14, $340,000 2014-15, $380,000 in 2015-16.
- In Qld expenditure was around: $250,000 in 2011-12, $230,000 in 2012-13, $250,000 in 2013-14, $250,000 in 2014-15, $255,000 in 2015-16.
- In WA expenditure was around: $300,000 in 2011-12, $310,000 in 2012-13, $305,000 in 2013-14, $312,000 in 2014-15, $320,000 in 2015-16.
- In SA expenditure was around: $150,000 in 2011-12, $180,000 in 2012-13, $175,000 in 2013-14, $170,000 in 2014-15, $200,000 in 2015-16.
- In Tas expenditure was around: $30,000 in 2011-12, $35,000 in 2012-13, $40,000 in 2013-14, $45,000 in 2014-15, $45,000 in 2015-16.
- In ACT expenditure was around: $30,000 in 2011-12, $50,000 in 2012-13, $35,000 in 2013-14, $30,000 in 2014-15, $30,000 in 2015-16.
- In NT expenditure was around: $50,000 in 2011-12, $55,000 in 2012-13, $70,000 in 2013-14, $55,000 in 2014-15, $60,000 in 2015-16.
State and territory government spending on early childhood services has also seen an upwards trend. However, it should be noted this has included funding received from the federal government through the National Partnership Agreement.
Western Australia and South Australia spend the greatest proportion of total budget expenditure on early childhood services. New South Wales spends the lowest.
When it comes to per-child spending on early childhood services, the Northern Territory spends the most, at $1,116 per child aged birth to 12 years in 2015-16. Again, New South Wales spends the least, at $246 per child.
Where to from here?
While Australia has lagged behind comparable countries over recent decades, the National Partnership Agreement has been a significant turning point. This long-overdue investment from governments to provide all Australian children with access to 600 hours of preschool education in the year before school has paid off enormously. It also shows what can be achieved when federal, state and territory governments work together.
However, there is more to do. Now is the time not only to continue this commitment, but to extend that access to high-quality, age-appropriate early education programs for three-year-olds.
We need a system that can deliver two years of quality preschool programs, as well as access for all Australian children during their crucial first five years of early development - wherever they live and whatever their family circumstances.
This article was originally published on The Conversation. Read the original article.


